Hi 👋 - Delivery is a game of inches. Small changes in a metric like deliveries per hour dictate profitability. Route density is an important consideration when evaluating delivery businesses like DoorDash and Uber. It’s also a good filter for thinking about a company’s TAM. As always, thanks for reading.
🚛 🚛 🚛 If you’re finding this content valuable, consider sharing it with friends or coworkers.
For more like this once a week, consider subscribing. 🚛 🚛 🚛
Route Density
Advice from lawn care professionals1 boils down to this: always be mowing. The cash register only rings when the lawn mower or leaf blower is running. Time spent in transit between jobs saps profitability. More time servicing properties and less time in a truck is key to success. In a low margin business like lawn care, route density is a matter of life or death.
Route density measures how close jobs (or deliveries) are to one another. A dream scenario is servicing every house on a cul-de-sac, subdivision, or homeowners association. Long distances between jobs are a nightmare. Driving 100 miles to a job or zig-zagging across town isn’t profitable (particularly with high gas prices). Constraining service areas2, filtering leads by location3, and letting go of far off, unprofitable customers4 are all tactics for improving route density.
Like lawn care, route density is critical to other low margin industries like e-commerce, food delivery, and ride sharing. Delivery is a game of inches and seconds. UPS routes its drivers to avoid time-sucking left turns. Business models that hum on four deliveries per hour can implode at three. While online businesses typically live or die by their CAC, route density (or lack thereof) is a common accomplice when delivery is involved. For example5:
“The biggest failure of Webvan was delivery density,” said Gary Dahl, vice president of distribution at Webvan from 1997 to 2001. In the Bay Area, he said, Webvan made money delivering in San Francisco and Oakland, but lost a lot of money delivering in suburbs such as Orinda and Moraga. “Mean travel time between delivery stops is the key to success in the home delivery business,” Dahl explained. “Travel one block in San Francisco and you have passed 200 people, travel one block in Moraga and you have passed about six people.”

Carpooling
Like Amazon or Walmart, Uber’s strategy is decreasing prices to increase adoption and volume. A lesson from UberX, the company's lower price offering, was that demand for transportation is highly elastic6. That is, reducing the price of a ride by X% increases demand by more than X% (and vice versa).
Armed with this insight, the company launched Uber Pool (now called UberX Share), a carpooling service, in August 2014. Here, a single driver picks up multiple fares heading in the same direction, increasing route density (the lawn care equivalent is mowing more lawns in the same subdivision).
Uber Pool would make Stephen Covey proud. It’s a win-win-win. Uber serves more riders with the same number of drivers. Riders get a lower price (albeit for a slightly longer ride and an elevated risk of small talk). Drivers get more fares. Given elastic demand, lower prices should spur higher demand, increasing marketplace liquidity and driver utilization rates, allowing even lower prices. A flywheel (in theory).

Given its ambitions and lofty valuation, Uber had to branch beyond its expensive black car service. Uber Pool was another step in capturing more of its total addressable market (TAM).
The Limitations of TAM
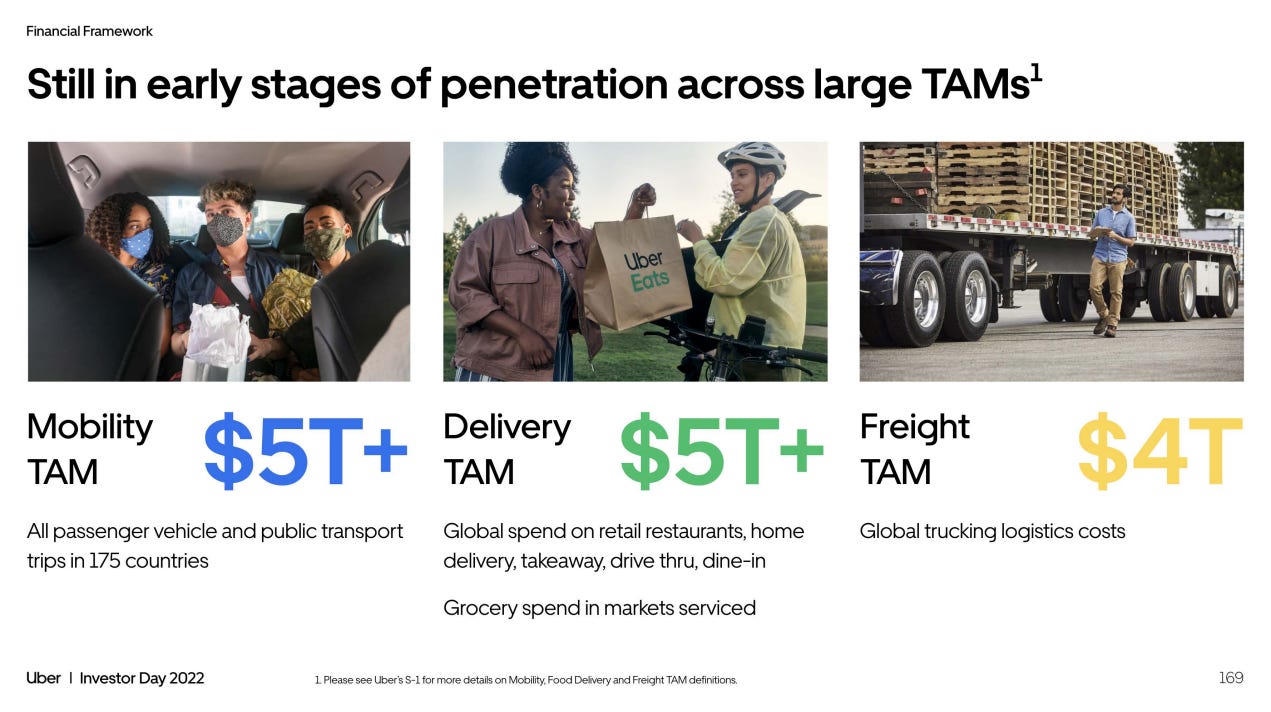
Defining TAM is a pissing contest for investment bankers. Flip through a S1 or investor deck and you’ll see a market opportunity a few orders of magnitude larger than the company’s current revenue. Uber is no exception. The company generously defines its TAM as north of $14 trillion (yes, with a “T”), equivalent to nearly one-half of US GDP.

Dig deeper through Uber’s S1 and it's clear that its TAM is just window dressing. The company is top-heavy. In ridesharing, a handful of cities represent a disproportionate amount of revenue. Since 2018, Uber’s top five metro areas accounted for 22-24% of total ride bookings. For context, today the company operates in 72 countries and over 10,000 cities (yet another example of power laws in tech).

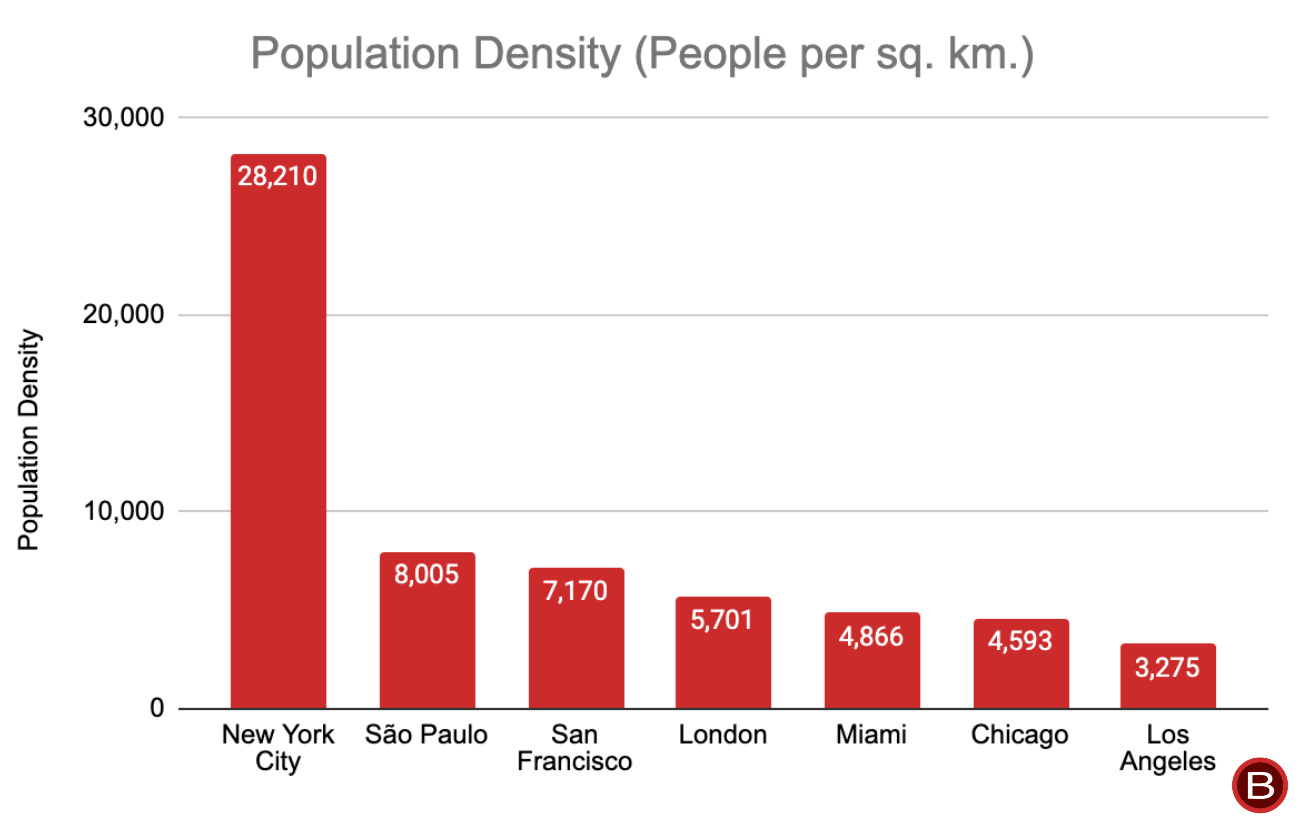
The list of top markets is fairly static. Over the past four years it's been some combination of Chicago, London, Los Angeles, Miami, New York City, San Francisco, and São Paulo. Unsurprisingly, all are dense urban areas, supporting high route density (as well as more competition). New Jersey - the densest state in the US - has 488 people per square kilometer7. Density in most of Uber’s top markets is an order of magnitude higher.


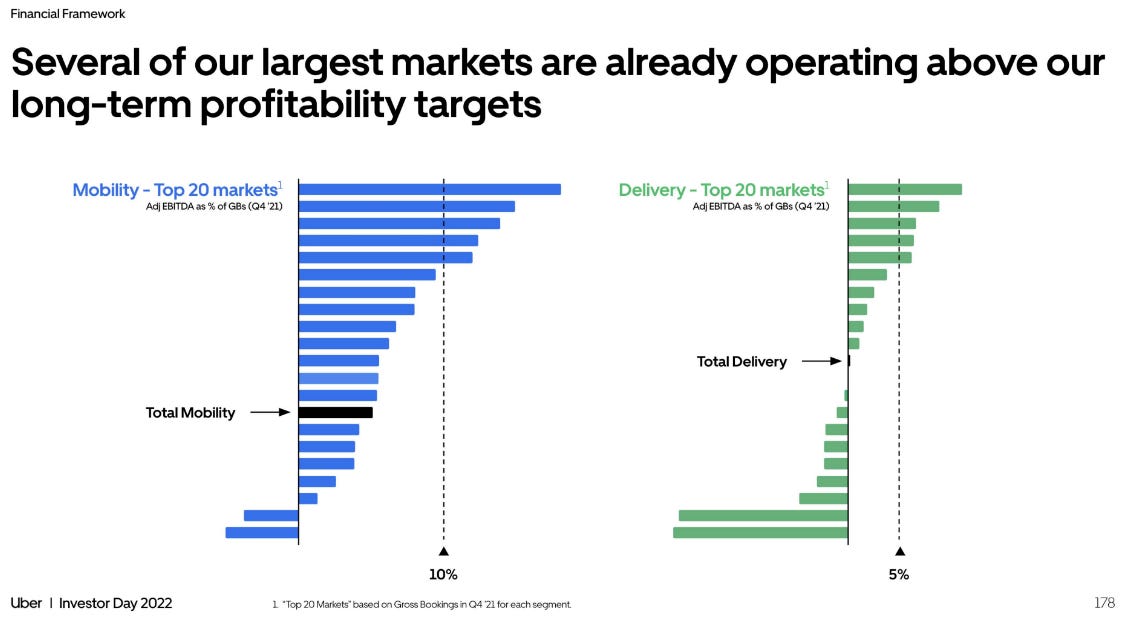
Uber’s Mobility segment profitability is also top-heavy. Big markets generate a disproportionate amount of ridesharing adjusted EBITDA and have higher margins. Here population density, route density, and TAM potentially conflict. Uber runs a profitable business in London and New York. Trouble is, there are only so many cities with similar characteristics like population density and high disposable income. I’ve lived in New York since 2008 so this is a biased opinion, but there’s no other city in the world like it like it. Similarly, London’s population density is over 10 times higher than the second most densely populated region of England (the North West)8.
A large TAM doesn’t necessarily translate into large profits. It’s wishful thinking to assume that profitability for the median market will look anything like profitability in the best markets over time. London can support a route density that Lincoln, Nebraska can’t. Just because Uber can serve thousands of markets, doesn’t mean it can serve them all profitably.

Not all growth is profitable growth - something Uber recently admitted. The lessons from lawn care suggest that Uber’s path to sustained profitability and free cash flow generation might involve cutting scope, narrowing TAM, and focusing on markets that can support the high route density. To its credit, Uber has exited markets like China and Southeast Asia where it faced stiff competition and bled cash. Expect more of this. Overgrown lawns look best after a trim. Overgrown TAMs too.
🚛 🚛 🚛 If you’re finding this content valuable, consider sharing it with friends or coworkers.
For more like this once a week, consider subscribing. 🚛 🚛 🚛
More Good Reads and Listens
Bill Gurley’s bullish view on Uber’s TAM. Business Breakdowns on Uber. Below the Line on the big market delusion.

The first thing you notice when you Google “route density” is that most of the results involve lawn care or landscaping.
Fullerton Unfiltered, Episode 213 - A Crash Course In Route Density, July 2021.
Green Industry Podcast, Reevaluating Route Density w/ Chris Gentry From Happy Cans Now, March 22, 2022.
Lone Star Lawn Talk, Episode 18 - Route Density talk with Naylor Taliaferro, March 15, 2022.
Reuters, From the ashes of Webvan, Amazon builds a grocery business, June 18, 2013.
Above the Crowd, Uber’s New BHAG: UberPool, January 30, 2015.
Wikipedia contributors, "List of states and territories of the United States by population density," Wikipedia, The Free Encyclopedia, https://en.wikipedia.org/w/index.php?title=List_of_states_and_territories_of_the_United_States_by_population_density&oldid=1098538119 (accessed July 16, 2022).
UK Office for National Statistics, Population estimates for the UK, England and Wales, Scotland and Northern Ireland, provisional: mid-2019, May 6, 2020.


Convinced that good businesses invest in geomatics and urban profiling- mobile (routes), fulfillment, and retail storefront planning. Sometimes obvious, sometimes not.
Coming back to this post after hearing that one of the DoorDash founders (Tony) ran a small lawnmowing business in his youth. Didn't directly cause him to start DoorDash later on, but a funny coincidence nevertheless.