Hi 👋 - Thumbnail art, the tiny images that occupy Netflix’s home screen, are the most important influence in determining what subscribers watch. Below we’re digging into how Netflix selects these images and digital economies of scale, but first I’d like to thank you for sharing your inbox with me. Below the Line turns 100 posts old today 🥳. I’m very grateful for your subscription and your time.
Normally, because I get uncomfortable when I have to ask people for help, I hide my ask to share this email at the bottom of the post. But to celebrate turning 100, I’m putting it front and center. If you enjoy Below the Line, please consider:
🥂 Forwarding this email to a friend or coworker.
🍾 Sharing a post you enjoyed on LinkedIn, Twitter, Reddit, or Facebook.
🎉 Sharing with your community or your company in Slack.
Thanks again for subscribing. There’s a lot of good stuff to read on the internet and I appreciate you choosing to spend a few minutes a week with me. 🙏
Now, back to Netflix. 🎬
Economies of Scale
Find me an MBA who hasn’t heard of economies of scale and I'll give you $1001. The concept is part of any business 101 program. Here’s how Harvard Business School professor Michael Porter defines it in his book Competitive Strategy:
Economies of scale refer to declines in unit costs of a product as the absolute volume per period increases. Economies of scale may deter entry by forcing the entrant to come in at large scale and risk strong reaction from existing firms or come in at a small scale and accept a cost disadvantage, both undesirable options.
As businesses shift from physical to digital, economic logic is changing. How Netflix decides which thumbnail image to serve to which subscriber is a case study in digital benefits of scale.
A/B Testing 101
A/B testing is at the heart of Netflix’s thumbnail selection process. An A/B test randomly assigns a sample of users into two groups: Group A and Group B. Random sampling normalizes attributes like length of membership, income, and geography that could bias results. Group A, the control group, sees the existing product. Group B, the treatment group, sees a new product experience. Tests are designed to provide both groups with an identical experience, except for an isolated test variable. For example, Group A sees a red button while Group B sees a blue button. The objective is showing causation between the product tweak and changes in user behavior. According to Netflix2:
Running A/B tests, where possible, allows us to substantiate causality and confidently make changes to the product knowing that our members have voted for them with their actions.
At the end of an A/B test, metrics from Group A and Group B are compared to see if there’s a difference in behavior between the two. Product managers look to see if the treatment positively impacted metrics relative to the control and, if so, if the change was statistically significant. A test typically looks at a primary metric, for example, click-through, conversion rates, or app load times, as well as a handful of secondary metrics.
If Group B sees a statistically significant uplift, then the product change is rolled out to all users (this sometimes happens in steps). If not, the product change is either binned or revised and re-tested. In the example below, the change tested (Product B) hurt user engagement, so this change would be scrapped.

Love at First Glance
The single biggest influencer of what people watch on Netflix is thumbnail art3. When browsing Netflix’s home screen, over eighty percent a viewer’s focus is on the art. The company has 90 seconds to grab a subscriber’s attention before they get bored and leave the app. To keep people engaged, Netflix needs to encapsulate an entire movie in an image the size of a matchbook that a viewer looks at for 1.8 seconds. No pressure.
Because there’s a lot riding on those little images, Netflix has developed a data-driven framework for finding the best artwork for each video and built a system for testing sets of images. An hour-long episode of Stranger Things has 86,000 static video frames to choose from4. Multiply that by Netflix’s content library and numbers get big, fast. Netflix utilizes a machine learning technique called aesthetic visual analysis (AVA) to digest this mountain of data. AVA algorithmically searches content for the images that users are most likely to click on. The process has two steps:
Frame Annotation: The goal here is to algorithmically understand each frame. An image recognition algorithm tags every video frame with metadata for attributes like brightness, contrast, probability of nudity, and sharpness. Results are stored in a database containing a digital fingerprint of each frame5.

Image Ranking: Once each frame is tagged and cataloged, an algorithm scours the metadata, selecting the specific shots that are most clickable. Three categories are important for choosing a good image: visual (brightness, contrast, motion blur), contextual (face and object detection, shot angles), and compositional (depth of field, symmetry).
Netflix’s creative team uses highly ranked frames to create the thumbnail art that subscribers see. Multiple thumbnails are created for each video. These are then A/B tested to determine which images individual users are most likely to click on. Different users get different thumbnails and Netflix measures engagement for each variant including click-through rate, aggregate play duration, and the percentage of plays with a short duration6.

Ultimately, Netflix is testing how quickly subscribers find a program to watch and that the selected thumbnails are increasing aggregate viewing time. The little images have a big impact on engagement7:
The results from this test were unambiguous — we significantly raised view share of the titles testing multiple variants of the artwork and we were also able to raise aggregate streaming hours.
A/B testing thumbnails is a dynamic process. Images change based on what a subscriber watches. For example, when a stand-up comedy fan searches for Good Will Hunting, they’re likely to be served a thumbnail featuring Robin Williams, while someone who watches rom-coms (guilty!) gets an image of Matt Damon kissing Minnie Driver.

As is often the case with big data, A/B testing thumbnails yields some unexpected results, allowing for granular personalization. For example:
Thumbnails showing complex emotions or expressive faces perform well:

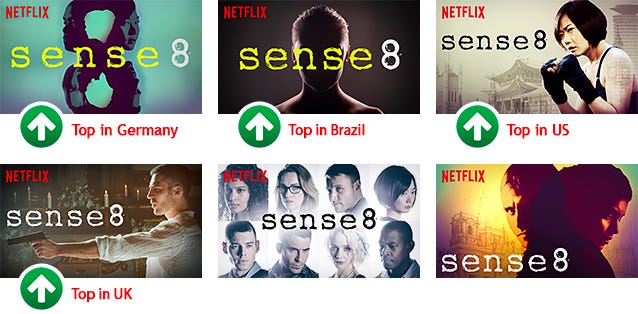
Winning images differ by region. Germans, for example, have a thing for abstract images:

For action and kids genres, villains and polarizing characters get more engagement. This unfortunate quirk of human nature carries over into social media as well:

There’s a significant drop in the popularity of an image when it includes more than three people. The art for the first season of Orange is the New Black contained an ensemble of characters, but later seasons included just one cast member:

Bigger, Faster, Stronger
While it has nothing to do with declining unit costs, there are benefits to scale in A/B testing, providing advantages for larger companies. For example, in early versions of Netflix’s A/B tests, two million subscribers were enough to determine winning images for popular titles, but niche titles required samples of twenty million subscribers8. Because only a small percentage of the sample watched niche titles, it took a large audience to draw statistically significant conclusions. Netflix, with nearly 214 million subscribers in Q3 2021, can get to significance faster than Disney+, HBO Max, or Hulu.

Similarly, an e-commerce company with higher order volume will be able to get to significance on a conversion rate test faster than a smaller competitor. That’s a potential compounding advantage. As you get bigger, you can get better, faster. Scale begets scale.
Larger user bases and transaction volumes also increases a company’s potential testing speed and velocity. That’s important because many A/B tests fail. For example, ninety percent of tests at Booking.com don’t produce a positive, statistically significant result9. However, Booking.com’s massive scale and rich culture of experimentation mean that it can run thousands of different A/B tests at a time. Failure is learning. As Thomas Edison said about creating the lightbulb:
I have not failed 10,000 times—I've successfully found 10,000 ways that will not work.
Scale in users and transactions creates a bigger sandbox for testing, allowing a company to learn faster, another area for potentially compounding advantages.
Similarly, the more you can A/B test, the more you can afford to be initially wrong. Scale, married with a culture of experimentation, creates a more forgiving business model. Spotify founder and CEO Daniel Ek hit on this during the company’s Q3 2021 earnings call:
So why does this velocity matter so much for Spotify? Well, I believe that…it will determine our long-term success. If you're slow, you better be right most of the time. But if you're fast, you can test and iterate more, which creates a culture of innovation. And at Spotify, we want to constantly iterate and improve.
It’s far easier to iterate and course correct than it is to consistently and accurately predict the future.
Lastly, the ability to A/B test at scale is an advantage for digital businesses compared to offline businesses. Selecting where to build a factory or locate a restaurant is an irreversible decision (or at minimum costly to reverse). In contrast, the layout of your home screen, flow of your conversion funnel, or color of your add to cart button are testable and malleable online. Compare a Netflix thumbnail to a roadside billboard or DVD cover. There are more one-way doors in the physical world than the digital world.

If you’re finding this content valuable, consider sharing it with friends or coworkers. ❤️
For more like this once a week, consider subscribing. ❤️
More Good Reads
Netflix's Technology Blog on the company’s framework for A/B testing thumbnail art. Trung Phan’s Twitter thread on how Netflix A/B tests thumbnails. This what got me interested in the topic, so hattip to Trung 🎩. Harvard Business Review on Booking.com’s culture of experimentation. Below the Line on the benefits of forced experimentation.
Disclosure: The author is an investor in Netflix.

This is hyperbole, not an actual offer.
The Netflix Tech Blog, What is an A/B Test?, September 22, 2021.
About Netflix, The Power of a Picture, May 3, 2016.
Vox, Why your Netflix thumbnails don’t look like mine, November 21, 2018.
Vox, Why your Netflix thumbnails don’t look like mine, November 21, 2018.
The Netflix Tech Blog, What is an A/B Test?, September 22, 2021.
The Netflix Tech Blog, Selecting the best artwork for videos through A/B testing, May 3, 2016.
The Netflix Tech Blog, What is an A/B Test?, September 22, 2021.
Stefan Thomnke, Harvard Business Review, Building a Culture of Experimentation, March-April 2020 Magazine.


Great one! Love the practical unpacking of A/B testing. Certainly scale and size unlock capabilities (like velocity) -- incumbents can "afford" to get it wrong. New entrants need to be right to gain market share. Key distinction between winning and not losing.